| Characteristic | Percentage change in value added |
|---|---|
| - | - |
| - | - |
| - | - |
| - | - |
| - | - |
| - | - |
| - | - |
| - | - |
| - | - |
| - | - |
| - | - |
| - | - |
| - | - |
| - | - |
| - | - |
| - | - |
| - | - |
| - | - |
| - | - |
| - | - |
The chart is not accessible to screen readers. Please switch to the table view to access the data.
Download
Source
Source
Release date
March 2020
More information
Region
Italy
Survey time period
2020
Supplementary notes
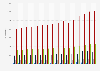
The data show the impact of the sanitary emergency in the Italian regions between 2019 and 2020.
The source considered the negative effects on the different economic sectors registered between the mid-February and the end of April. Data are adjusted with regard to the number of infected individuals as of March 2.
The estimates are added algebraically to the forecasts made for 2020 before the outbreak of COVID-19. They do not take into account the effects of the cooling off of domestic demand (potential loss of jobs) and the slowdown in world trade.
Citation formats