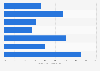
| Characteristic | Year-on-year change in passenger volume |
|---|---|
| - | - |
| - | - |
| - | - |
| - | - |
| - | - |
| - | - |
| - | - |
The chart is not accessible to screen readers. Please switch to the table view to access the data.
Download
Source
Source
Release date
June 2025
More information
Region
China
Survey time period
2024
Supplementary notes
According to the source, the passenger statistics are provided by CLIA's ocean cruise line members, which covered over 95 per cent of the global cruise industry capacity. Additional data was also collected from non-CLIA cruise lines by CHART Management Consultants.聽
To serve a consistent manner, one-night cruises were excluded in the analyses.
Citation formats