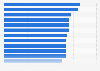
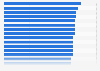
| Characteristic | Share of respondents |
|---|---|
| - | - |
| - | - |
| - | - |
| - | - |
| - | - |
| - | - |
| - | - |
| - | - |
| - | - |
| - | - |
| - | - |
| - | - |
| - | - |
| - | - |
The chart is not accessible to screen readers. Please switch to the table view to access the data.
Download
Source
Sources
Release date
November 2019
More information
Region
Russia
Survey time period
July 26 to August 9, 2019
Number of respondents
19,516**
Age group
16-64 years
Method of interview
Online panel
Supplementary notes
* The question was originally worded as follows: "Please indicate how
good or poor you rate the current quality of each one in [COUNTRY]鈥�" The figures represent the share of respondents who found the infrastructure very or fairly good in each category.
** The number of respondents in Russia only was not specified. 19,516 respondents in 28 countries around the world; 18-64 years old or 16-64 years old depending on the country.
Citation formats