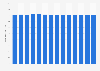
| Characteristic | Share of respondents |
|---|---|
| - | - |
| - | - |
| - | - |
| - | - |
The chart is not accessible to screen readers. Please switch to the table view to access the data.
Download
Source
Source
Release date
December 2018
More information
Region
United States
Survey time period
November and December 2018
Number of respondents
5,402 respondents
Special properties
results do not necessarily represent LGBTQ community members who are not out or not interacting within the LGBTQ community
Method of interview
Online survey
Supplementary notes
Question was phrased by source as "Do you agree or disagree with these statements about hotels? 'I tend to stay at hotel brands that I know are LGBTQ-welcoming.'"
Citation formats