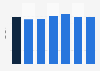
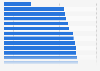
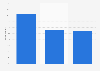
| Characteristic | Share of respondents |
|---|---|
| - | - |
| - | - |
| - | - |
| - | - |
| - | - |
| - | - |
| - | - |
| - | - |
| - | - |
| - | - |
| - | - |
| - | - |
| - | - |
| - | - |
| - | - |
| - | - |
| - | - |
| - | - |
| - | - |
| - | - |
The chart is not accessible to screen readers. Please switch to the table view to access the data.
Download
Source
Source
Release date
August 2019
More information
Region
Hungary
Survey time period
May 24 to June 7, 2019
Number of respondents
Over 500
Method of interview
Online survey
Supplementary notes
* The results show the share of respondents saying "Does or could give me greatest happiness" for the top 20 sources globally. The response alternatives were as follows: "Does or could give me greatest happiness, does or could give me some happiness, doesn't or couldn't make me happy or happier, does not apply to me."
Citation formats