| Characteristic | Decrease | Remain the same | Increase |
|---|---|---|---|
| - | - | - | - |
| - | - | - | - |
| - | - | - | - |
| - | - | - | - |
| - | - | - | - |
| - | - | - | - |
| - | - | - | - |
The chart is not accessible to screen readers. Please switch to the table view to access the data.
Download
Source
More information
Region
United States
Survey time period
November 6 to 28, 2018
Number of respondents
441**
Special properties
construction industry executives
Supplementary notes
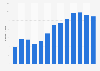
Original question phrased as, "What is your projection for local residential construction activity in 2019 compared to 2018?"
** Number of respondents surveyed vary by year: 2019 - 262, 2018 - 150; 2017 - 194; 2016 - 248; 2015 - 413; 2014 - 552; 2013 - 370.
Citation formats