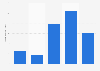
| Characteristic | Net income in million U.S. dollars |
|---|---|
| - | - |
| - | - |
| - | - |
| - | - |
| - | - |
| - | - |
The chart is not accessible to screen readers. Please switch to the table view to access the data.
Download
Source
Source
Release date
March 2020
More information
Region
Canada, United States
Survey time period
2014 to 2019
Supplementary notes
* Net income for fiscal 2018 and fiscal 2017 includes $1.0 million and $8.5 million, respectively, of net additional income tax expense as a result of the Tax Cuts and Jobs Act of 2017.
**Fiscal 2017 consisted of 53 weeks while all other periods presented consisted of 52 weeks.
Citation formats