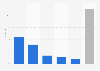
| Characteristic | Number of tourist arrivals in millions |
|---|---|
| - | - |
| - | - |
| - | - |
| - | - |
| - | - |
| - | - |
| - | - |
| - | - |
| - | - |
| - | - |
| - | - |
The chart is not accessible to screen readers. Please switch to the table view to access the data.
Download
Source
Sources
Release date
February 2022
More information
Region
China
Survey time period
2009 to 2019
Supplementary notes
From 2016: including arrivals of non-residents visitors through border areas in China. The data are not comparable with those of previous years;
Excluding ethnic Chinese arriving from Hong Kong, Macao, Taiwan, and overseas Chinese.
Values have been rounded.
Citation formats